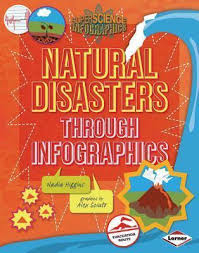
Natural Disasters Through Infographics: Super Science Infographics
Rowell Rebecca
Series: Super Science Infographics
Publication Date:
1 Oct. 2013
Format:
Paperback / softback
ISBN 9781467715935
The facts about natural disasters are so big and devastating they could make your head explode! You hear about huge costs (like the $360,000,000,000 in damage caused by the 2011 tsunami in Japan), huge speeds (the fastest-moving tsunami waves have been recorded at 500 miles per hour), and even huger mysteries (where, exactly, the danger zones are for natural disasters).
How can all these big numbers and concepts make more sense? Infographics! The charts, maps, and illustrations in this book tell a visual story to help you better understand key concepts about natural disasters. Crack open this book to explore mind-boggling questions such as:
• How can scientists accurately predict natural disasters?
• What were some of Earth’s biggest, freakiest, and deadliest disasters?
• How can you protect yourself in the event of a volcano, an earthquake, or a tsunami?
The answers are sure to shake you up!
How to Use the Site:
MEMBER DISCOUNTS: For Member pricing, please sign in to your Book Curator account.WISH LISTS: Signing in will also allow you to create a wish list. Just choose the heart icon on each product you want to add. To view your list, click on the heart icon at the top right of your screen.
COMPARING PRODUCTS: To compare products, use the scales icon.
TO VIEW OR COMPLETE YOUR ORDER: Click on the cart icon at the top right of your screen.
SHIPPING: Enjoy the low flat rate of just 12.95 shipping and handling to anywhere in Australia, no matter how large your order is.
